
About this video
Is demand falling, or are you losing share? Compare two complete Search Query Performance weeks for the same products and searches, because each situation needs a different response. Chapters 0:00 Separate the market from your position 0:35 Read the market denominator first 1:11 More purchases can still mean less share 1:49 Find the product-level divergence 2:26 A complete week is not always mature attribution 2:57 Revise the decision when evidence changes 3:34 Create a repeatable weekly review ScaleSKUs connects your Amazon Seller Central and Amazon Ads account to the AI you already use, such as Claude, ChatGPT or Gemini, over MCP. Ask in plain language, review the evidence, and approve every change. ▶ Start your 30-day free trial: https://scaleskus.com/mcp ▶ Hinglish mein dekhein: https://youtu.be/YN-KqSbegl4 ▶ Full playlist: https://www.youtube.com/playlist?list=PLKDH05txqnqI
Transcript
When sales change, the first explanation is often that demand has slowed. Sometimes that is true. Sometimes the market is growing and your product is losing share. Those situations require different responses. In this lesson, we compare two complete Search Query Performance weeks for the same walnut products and searches. Start with a simple question: is demand falling, or are we losing our share?
Ask for market search volume and market purchases separately from your impression, click and purchase shares. Keep the product set fixed. A changing selection can create an apparent trend that is really just a different comparison. The comparison covers September thirteenth through nineteenth, then September twentieth through twenty-sixth. For walnuts without shell, market searches increase from roughly ninety-five thousand to one hundred and six thousand.
Market purchases rise from three thousand four hundred and eighty-six to four thousand two hundred and fifty-three. The checked market is expanding. Other important walnut searches also show higher demand. This does not prove that every part of the category grew, but it challenges the explanation that these products suffered because the searches disappeared. Name the checked queries and dates rather than turning a specific finding into an account-wide claim.
For the same selected products, purchases associated with walnuts without shell rise from four hundred and eight to four hundred and forty-two. That sounds positive. However, purchase share falls from eleven point seven percent to ten point three nine percent because the market grows faster. These statements are compatible: more absolute purchases, but a smaller slice of demand. The difference is about one point three one percentage points, not one point three one percent.
This is why your report should contain both the count and the share. Looking at only one can lead to a misleading diagnosis or an unnecessary account-wide reaction. Now break the combined trend into products. One walnut product loses impression, click and purchase share, while the stronger candidate gains those shares. The account-level average hides that divergence. Investigate the affected product's exposure, availability, offer and actual advertising path.
Do not assume that a gain on one product caused a loss on another. Likewise, do not immediately shift every budget to the apparent winner. Product fit and dates still matter. The useful conclusion is a focused investigation on the weaker product and query, rather than a broad statement that the entire walnut business has a demand problem. The next question compares advertising over the same dates.
Here we need an extra check. The first answer described both weeks as settled, but the report-specific evidence did not support that. The search-term tool gives a settled-through date of September twenty-second. The later week includes four days after that boundary. An account summary used a different settlement signal, so we follow the explicit warning for the report we are analysing.
A complete calendar week in Search Query Performance is not the same as fully mature attributed sales in an advertising report. Keep those two clocks separate before judging efficiency. The newer advertising sales and order figures are provisional. We can investigate the completed search-share movement now, but we should not treat the apparent advertising-sales decline as final corroboration. The corrected decision is to investigate walnuts without shell while holding bid, budget and ownership changes.
Other searches with encouraging query shares can be monitored and preserved until the advertising window matures. For size-specific searches, product-pack verification remains an additional condition. This is an important habit: when a data limitation appears, update the action, not only the footnote. A qualified conclusion should lead to a qualified decision. Your final review needs the fixed product set, the two complete query weeks, absolute market demand, your shares and counts, and the maturity status of the advertising comparison.
Record the date at which you will repeat the query. In this example, rerun the same later advertising window once its explicit settled-through date reaches September twenty-sixth or later. Do not silently switch to a different date range and call that a like-for-like update. For practice, pick one declining product and write two competing explanations: shrinking opportunity, or weaker capture of opportunity.
Then use the matched data to decide which explanation deserves investigation.
More videos
 4:55
Demand vs Share (Hinglish) · ScaleSKUs MCP Academy #14
1 Oct 2026
 4:48
Action Forensics · ScaleSKUs MCP Academy #20
1 Oct 2026
 4:41
Rule Coordination · ScaleSKUs MCP Academy #19
1 Oct 2026
 4:42
Scope Validation · ScaleSKUs MCP Academy #18
1 Oct 2026
 4:44
SP SB Intent · ScaleSKUs MCP Academy #17
1 Oct 2026
 4:48
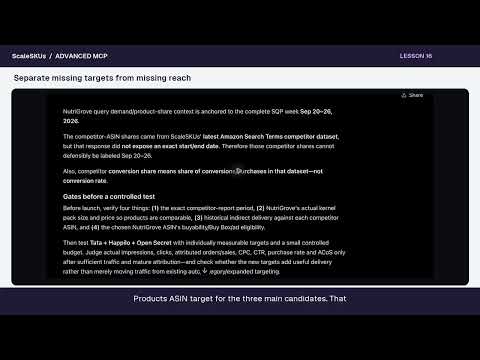
Competitor Fit · ScaleSKUs MCP Academy #16
1 Oct 2026